Analyze Perf Sampling With Trace Compass
Perf sampling and flame graphs are widely used to profile an application and understand where it spends most of its time. These features are documented here. This post will explain how to interactively analyze a perf sampling trace with flame graphs and Trace Compass.
Obtain a perf CTF trace
Note The perf to CTF conversion of sampling’s callchain was added in kernel version 4.13 and is needed to be able to visualize flame graphs in Trace Compass. Earlier kernel will not have this version of perf and flamegraphs will not be available.
First, a perf trace must be obtained in the usual way. For example, the following command will generate a perf sampling trace, with a sample taken on all CPU 99 times per second during 30 seconds.
perf record -F 99 -a -g -- sleep 30
Then, if your Linux distro supports perf2ctf conversion, the following command will convert the trace to a CTF format that can be read by Trace Compass:
perf data convert --all --to-ctf=./ctfdata
If you get a “No conversion support compiled in”, then you’ll need to compile perf with libbabeltrace before running the previous command.
The ‘–all’ flag also convert the perf_mmap[2] events to allow symbol resolution.
Now don’t forget to change the ownership of the ctfdata folder. Since the perf commands are usually run as root, Trace Compass will not be able to read the trace otherwise.
Also, for the kernel symbols to be resolved, one needs to obtain the kallsyms from the kernel to import them in Trace Compass later. The following command will get those symbols:
cat /proc/kallsyms > /path/to/my/trace/kallsyms
Install the perf feature
The feature needed to analyze a perf trace is the “Perf Profiling (Incubation)” feature, in the Trace Compass Incubator. See the instructions to install incubator features.
This feature will add a new trace type under “Common Trace Format” called “Perf 2 CTF trace”. The trace type should be automatically detected when importing such a trace. It also adds 2 specific analyzes for that trace type:
- Perf mmap Symbols for symbol resolution. Note that symbol resolution uses the perf_mmap[2] events that have links to binaries and libraries used by threads and processes. To have accurate symbol resolution, the trace has to be visualized on the same machine that generated it (for now).
- Perf Sampling under which are the flamegraph and calling context tree views.
Analyzing the trace
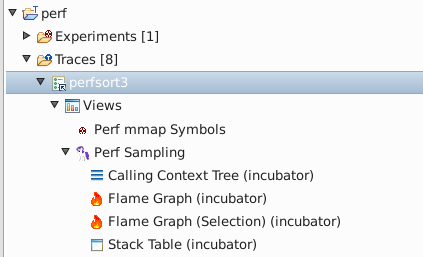
The trace can now be imported in Trace Compass. The trace type should be detected automatically. If it is not, it can be set by right-clicking on the trace, select trace type -> Common trace format -> Perf 2 CTF trace, and open the trace.
To get the flamegraph, expand the trace, Views element, then Perf Sampling, there’s a flame graph view that will show data for the entire trace, and another one will calculate the flamegraph only for the time selection.
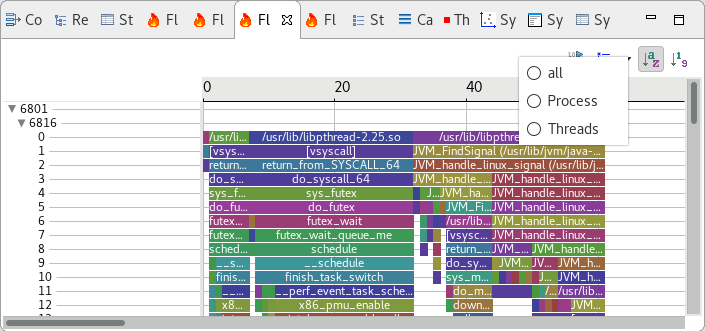
As the following screenshot shows, there is an arrow button on the upper right corner that allows to select how to group the sampling data, either all together, by process, or by thread.
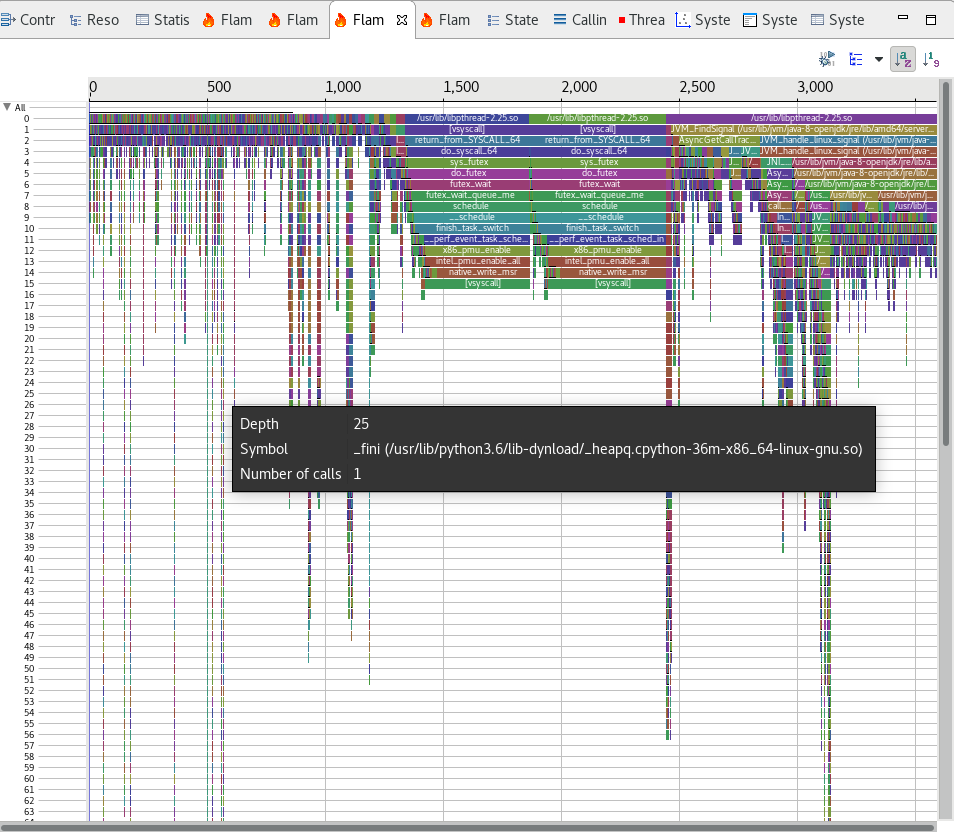
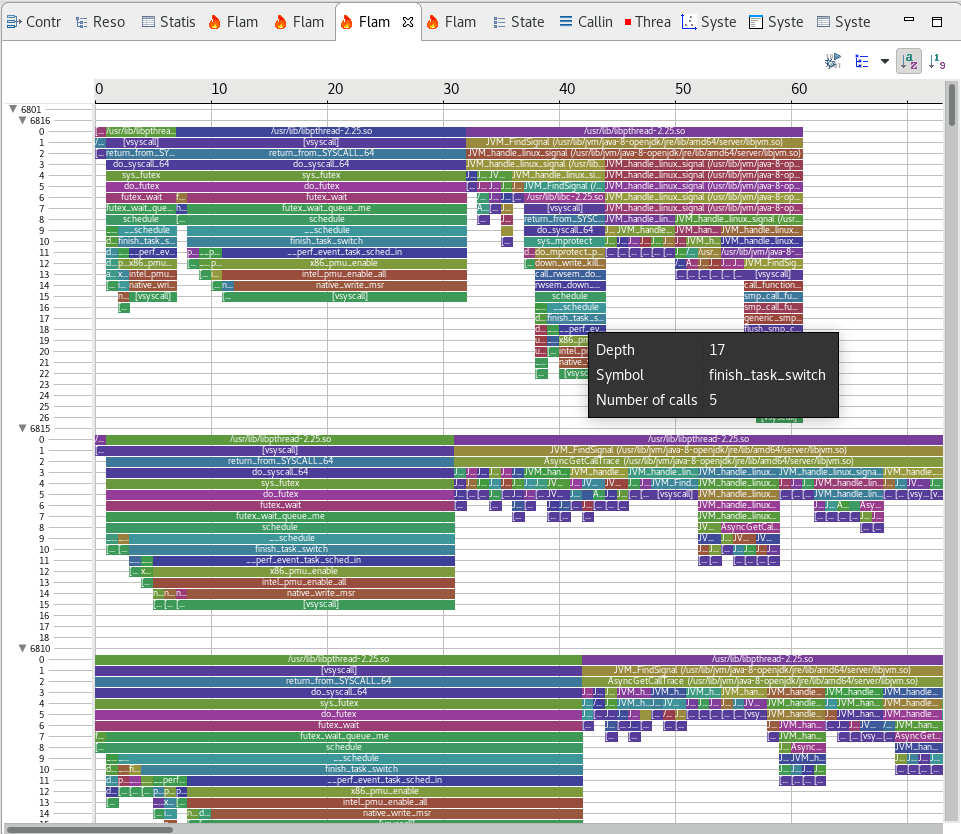
The following 2 screenshots show respectively the flamegraph data grouped all together or by thread:
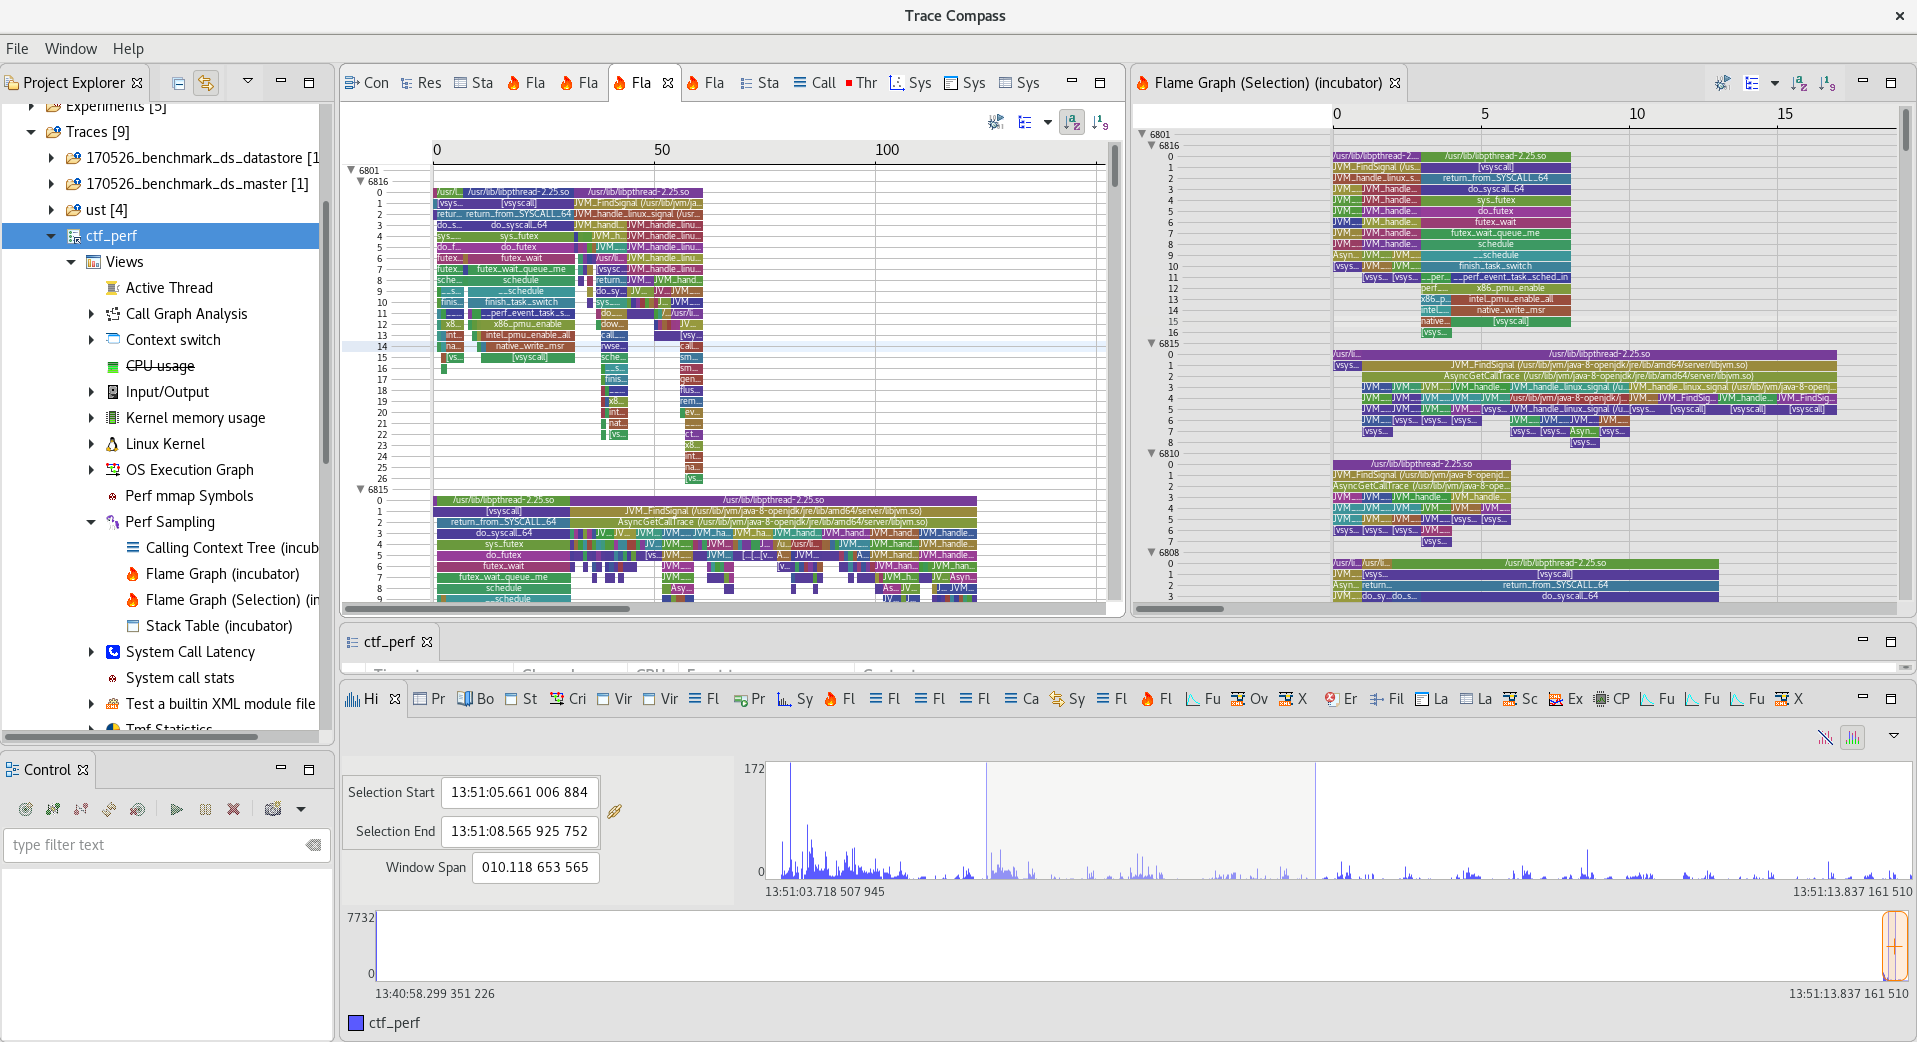
The view Flame Graph (Selection) shows the sampling data only for the selected time range. To select a time range, for instance, one can use the Histogram view or any other view that has time. The following screenshot used the Histogram view to select a time range in the view and we see both flamegraphs, one for the selection, one for the whole trace side by side. They can be independently grouped by any group.
If some symbols are represented as hexadecimal strings, it may mean the symbols have not been properly configured. Either right-click on the trace and select Configure symbols, or click the left-most button of the flame graph views. You can add the kallsyms file that has been saved previously. If some symbols are still not resolved, they may not be available. For instance, some languages may require additional symbol mapping files, to be obtained with tools like perf-map-agent for Java applications.
Current limitations of the perf2ctf analysis
- Symbol resolution is not saved between Trace Compass session, so each time we open a perf trace, we need to configure how to resolve the symbols by importing the kallsyms mapping file and any other required file.
- Some events are set at timestamp 0, so the trace range might be huge with only the end of the trace having events.
- The trace must be visualized on the same machine where it was taken to have correct symbol resolution. Otherwise, a library with the same name but different build might exist on the visualization machine and give false results.
- The colors are somewhat random and should have more meaning, as is the case with other perf flamegraphs.