Trace Compass Scripting: Empowering Users With Their Trace Data Analysis
User-Defined Analyzes
Trace Compass allows to visually analyze computer tracing data. It supports all kind of traces, from very high throughput operating system traces (ftrace, perf, lttng-modules) to userspace traces of various format, binary (CTF traces), json (trace event traces), pcap, log files, etc.
There are many builtin views and analyses in Trace Compass, mostly for common trace types like Linux Kernel traces, using known tracepoints, or function entry/exit semantics. But there are limits to those builtin analyses. When it comes to analyse user space traces and logs specific to one’s application, or make different analyses with other tracepoints from the builtin trace types, there are a few possibilities for the user.
Until a few weeks ago, there were only 2 ways to add analyses to Trace Compass: 1- Either the user became a developer and wrote analyses in the java code, 2- or he/she could use data driven XML analyses.
The first approach gives the user all the flexibility they need, but requires the Eclipse IDE, getting familiar with the Trace Compass code and API, has a high learning curve and sharing the analysis requires packaging one’s own Trace Compass RCP!
The second approach can work with the released version of Trace Compass, can be easily shared between users. But while it works for simple use cases or even more complex ones, XML’s declarative structure is not adapted when complex computations are involved.
Introducing EASE Scripting
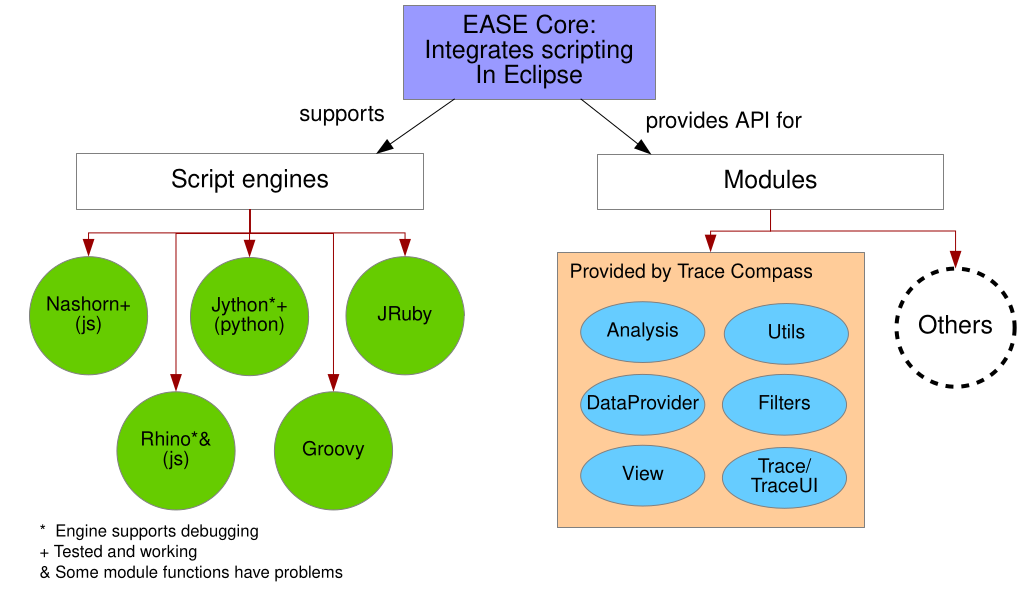
We’re introducing a third approach, Trace Compass Scripting, using the Eclipse EASE Framework. EASE adds scripting capabilities to Eclipse. It supports a few scripting languages (javascript, python, groovy, ruby). The scripts are then run in the context of the running Eclipse instance, like Trace Compass. It can directly access any java class if you know it’s full package path. Applications supporting EASE, like Trace Compass, can also provide modules that can be loaded in scripts to give access to helper methods.
This approach combines the flexibility of writing code that accesses the complete Trace Compass API and the simplicity to add analyzes directly in a running instance of Trace Compass. This feature is provided through the Trace Compass Incubator project, and needs to be installed as an Add-on (using the Tool -> Add-ons… menu). The complete documentation explains how to install and use EASE in Trace Compass for any of the available scripting engines.
To help users get started with EASE Scripting for trace analysis, Trace Compass provides a scripting API with methods that wrap some commonly used functionnalities.
Script Execution Example
We’ll show an example of how to write a custom script. Let’s take a typical Linux Kernel trace, obtained with your favorite Linux tracer and enabling the necessary events (for this example, syscalls and sched* events are enough). If you don’t have a kernel trace handy, you may use the kernel trace from the Tracing Summit 2019 ls demo.
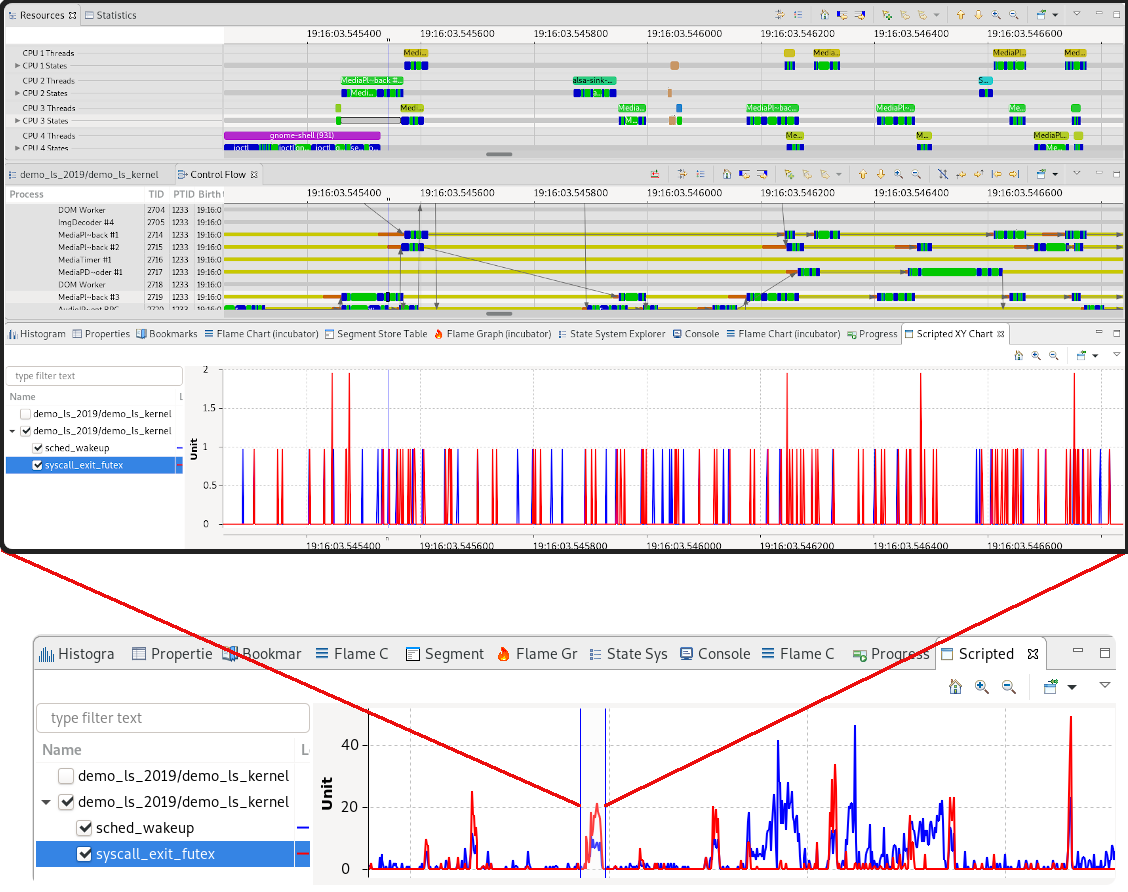
Let’s say we want to quickly approximate the moments in our trace where there was a lot of contention between threads that use futexes for synchronization. A thread will be blocked for a certain duration while the futex is being held by another. The typical event pattern would be to have a sched_wakeup event, shortly followed by a syscall_exit_futex event. If we make a chart with those events’ count, we can see the regions of the trace where there is strong correlation between them and estimate that this is where contention takes place.
This analysis would be very hard to do with what’s built into Trace Compass. But we’ll script it.
We’ll create the script file by right-clicking on the Eclipse project and selecting New -> File, naming it stats.js.
The first section of the script will be to load the appropriate modules. For this example, we’ll need Trace, Analysis, DataProvider, and View:
loadModule("/TraceCompass/Trace");
loadModule('/TraceCompass/Analysis');
loadModule('/TraceCompass/DataProvider');
loadModule('/TraceCompass/View');
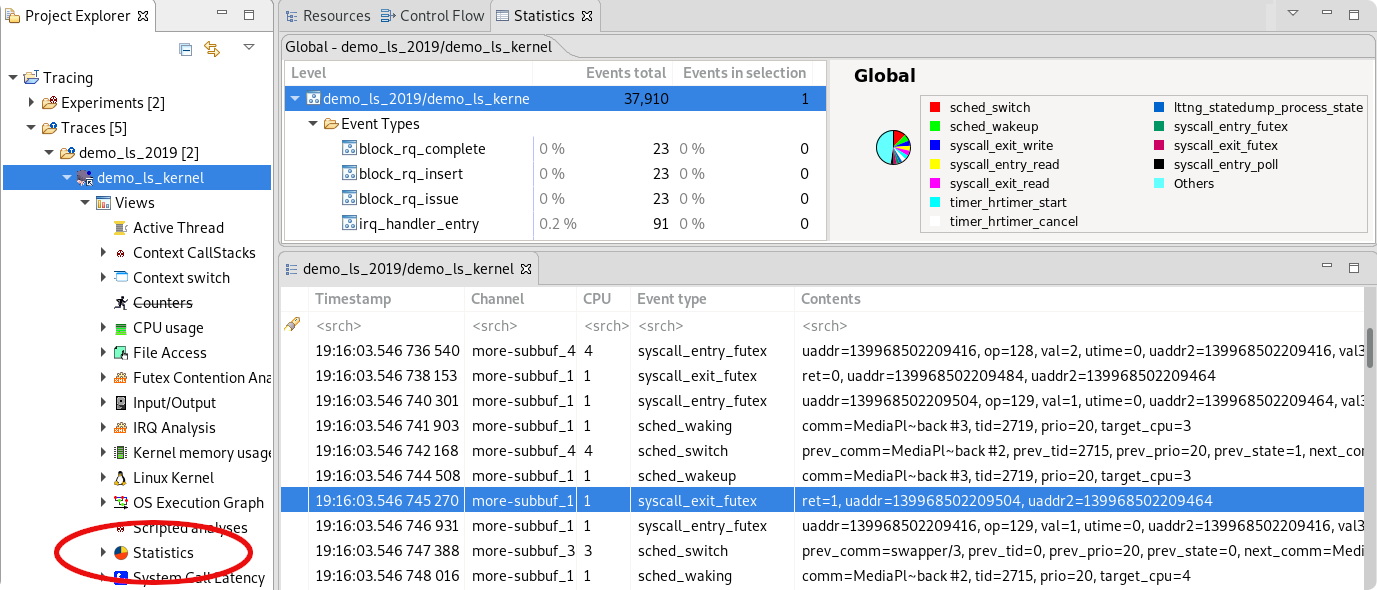
The events are already counted in the built-in Statistics analysis module, so we’ll use this module as the input for our analysis, no need to read the trace in this case. The trace needs to be opened first, as we’ll take the currently active trace and we get the Statistics module by the name we see under the Views element of the UI.
// Get the currently active trace
var trace = getActiveTrace();

if (trace == null) {
	  print("Trace is null");
	  exit();
}

// Get the Statistics module (by name) for that trace
var analysis = getTraceAnalysis(trace, 'Statistics');
if (analysis == null) {
	  print("Statistics analysis not found");
	  exit();
}
Since we want to observe the event count for both events, we’ll make an XY view to show the event count in time. But first, we need to create a data provider to describe the data to show in this view. But how? It’s not an analysis that we’ve built in the script, we just know the data is there somewhere. So how to get only what we require?
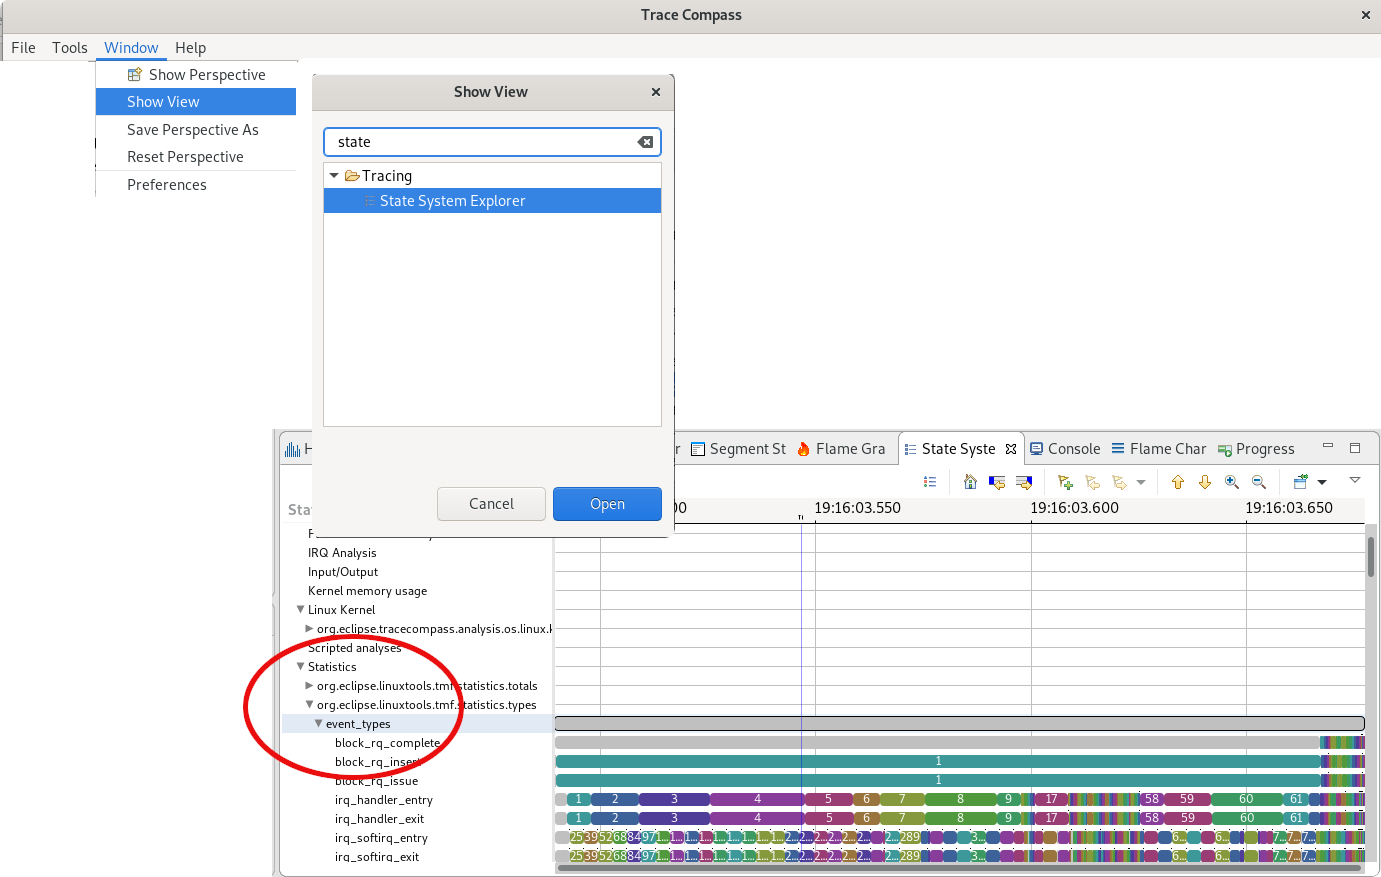
Most analyses in Trace Compass use a backend called a state system. It contains the history throughout the trace of the values/states taken by various attributes/objects in the system. Each analysis decides what are the attributes and the meaning of those states. We can see the content of a state system using the State System Explorer view (Window -> Show View and find the state system explorer). Expanding the analysis we are interested in, we can see its state system structure and values.
In the case of the Statistics analysis, we see that one of the state systems has an event_types attribute under which are the event names, for which we have the count.
We’ll thus create a data provider that will use a regex for the ENTRY_PATH to get only the sched_wakeup or the syscall_exit_futex event. Since we want to show the count at every time step, we’ll make sure to display the count difference with the previous count by setting the ENTRY_DELTA to true. If the provider is correct, we can directly open the XY chart view taking it as parameter.
// Prepare the parameters for the data provider:
var map = new java.util.HashMap();
map.put(ENTRY_PATH, 'event_types/sched_wakeup|syscall_exit_futex');
map.put(ENTRY_DELTA, true);
// create a XY data provider
var provider = createXYProvider(analysis, map);

// Open an XY chart with this data provider
if (provider != null) {
	  openXYChartView(provider);
}
Now, we can execute the script by right-clicking on the stats.js file and selecting Run As… -> Ease Script. It will open the Scripted XY Chart view. We can check the entries to display, ie the 2 events we’re interested in, and the event count lines will be shown. In this view, we see that around the third of the trace there is a region where the lines have similar topology. That’s a sign of possible contention on futex. Zooming in and looking at the Resources and Control Flow views, we indeed see that some MediaPlayer threads (threads of the firefox process) seem to be woken up after a futex is released and the pattern seems to indeed suggest contention at that moment.
Here is the full script for this analysis:
loadModule("/TraceCompass/Trace");
loadModule('/TraceCompass/Analysis');
loadModule('/TraceCompass/DataProvider');
loadModule('/TraceCompass/View');

// Get the currently active trace
var trace = getActiveTrace();

if (trace == null) {
	  print("Trace is null");
	  exit();
}

// Get the Statistics module (by name) for that trace
var analysis = getTraceAnalysis(trace, 'Statistics');
if (analysis == null) {
	  print("Statistics analysis not found");
	  exit();
}

// Prepare the parameters for the data provider:
var map = new java.util.HashMap();
map.put(ENTRY_PATH, 'event_types/sched_wakeup|syscall_exit_futex');
map.put(ENTRY_DELTA, true);
// create a XY data provider
var provider = createXYProvider(analysis, map);

// Open an XY chart with this data provider
if (provider != null) {
	  openXYChartView(provider);
}
Of course, this is a simplistic example. If we’re not debugging performance issues on firefox, the fact that there is a microsecond of contention is not very important. But we could have observed this for our application or some running server process that contends our system. Or we could try doing the same analysis with other events to correlate, for eg. net_if_receive_skb and sched_wakeup.
Read Trace And Analyze Example
Or by reading the trace in the script, we could make a smarter analysis that would count only the events that concern our application of interest, or events with specific fields, etc.
The following script reads the trace and makes a state system that keeps count of how many times a thread has been woken up. We can then make an XY chart of the wake up counts through time.
// load Trace Compass modules
loadModule('/TraceCompass/Analysis');
loadModule('/TraceCompass/DataProvider');
loadModule('/TraceCompass/View');

// Create an analysis named wakeups
var analysis = getAnalysis("wakeups");

if (analysis == null) {
	print("Trace is null");
	exit();
}

// Get the analysis's state system so we can fill it, false indicates to create a new state system even if one already exists, true would re-use an existing state system
var ss = analysis.getStateSystem(true);

// The analysis itself is in this function
function runAnalysis() {
	// Get the event iterator for the trace
	var iter = analysis.getEventIterator();

	var event = null;
	// Parse all events
	while (iter.hasNext()) {

		event = iter.next();

		// Do something when the event is a sched_switch
		if (event.getName() == "sched_wakeup") {
			// This function is a wrapper to get the value of fields in the event, or return null if the field is not present
			tid = getFieldValue(event, "tid");
			comm = getFieldValue(event, "comm");
			timestamp = event.getTimestamp().toNanos();
			if ((tid != null) && (comm != null)) {
				// Use tid/comm as attribute name, tid is a long, so "" + tid make sure it's a string
				quark = ss.getQuarkAbsoluteAndAdd("" + tid + "/" + comm);
				// modify the value, for display purposes
				org.eclipse.tracecompass.statesystem.core.StateSystemBuilderUtils.incrementAttributeLong(ss, timestamp, quark, 1);
			}
		}

	}
	// Done parsing the events, close the state system at the time of the last event, it needs to be done manually otherwise the state system will still be waiting for values and will not be considered finished building
	if (event != null) {
		ss.closeHistory(event.getTimestamp().toNanos());
	}
}

// This condition verifies if the state system is completed. For instance, if it had been built in a previous run of the script, it wouldn't run again.
if (!ss.waitUntilBuilt(0)) {
	// State system not built, run the analysis
	runAnalysis();
}

// Prepare the parameters for the data provider:
var map = new java.util.HashMap();
map.put(ENTRY_PATH, '*');
map.put(ENTRY_DELTA, true);
// create a XY data provider
var provider = createXYProvider(analysis, map);

// Open an XY chart with this data provider
if (provider != null) {
	  openXYChartView(provider);
}
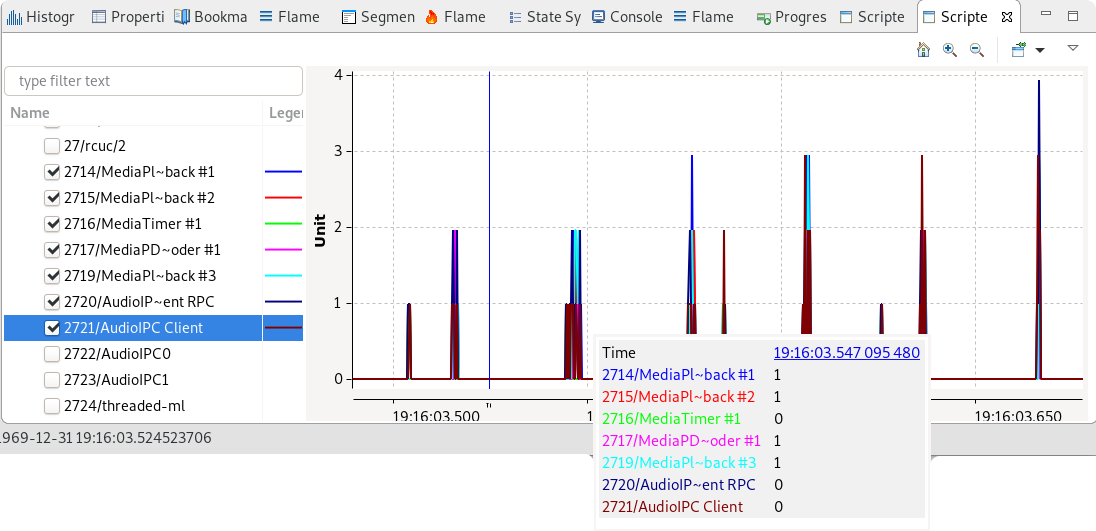
This will show as entries all the threads for which there was a wakeup in the trace. We can check only those that interest us and observe the wakeups. Here, they are all gathered around the same times, which is pretty much where the peaks of sched_wakeup/syscall_futex_exit correlation were in the previous chart.
Note: The scripts in this post work with Trace Compass 5.1, not yet released as of this writing, but available as a development snapshots
Conclusion
The Scripting feature opens up the entire Trace Compass and Trace Compass Incubator API to the user, without having to re-compile/re-build Eclipse and Trace Compass. It is a very powerful tool put in the hands of the end users that we hope will help you get the most out of your traces, combining custom or built-in trace visualization with very fine-tuned script results oriented towards one’s precise use case.
While the whole API is available, the simplest and ideal is to use the helper methods provided by the Scripting API. This API is far from exhaustive for now. It is under constant development. Feedback and ideas are welcome, to help us make this API better and hopefully sufficient for most of the use cases.
- Need help or have comments?
Chat with our friendly and helpful community on the IRC channel (the #tracecompass channel on the OFTC network) or contact the Trace Compass mailing list.
- Think of something that should be available through a helper method?
Request a feature for it or develop it in the Trace Compass Incubator project (org.eclipse.tracecompass.incubator.scripting.*) and contribute it through gerrit.
- Find bugs?
Report it, attaching the script and trace that caused it.
- Made an awesome script that should be shared with the whole community?
Contact the community, either through the IRC or mailing links above, or contribute it as an example in the code, or attach it to a feature request so we can add it at the appropriate place.